


The past success of Summer League standouts such as Anthony Randolph, Nikoloz Tskitishvili, and Donte Greene suggest that Summer League performances have little predictive power for how one will perform in the NBA. Maybe it is because the sample size of just five or six games is small enough that getting hot during a few games could skew one's numbers positively or negatively. Or maybe the general dysfunction of the Summer League, where teams and coaching staffs are hastily assembled, and extremely young NBA players are paired with grizzled journeymen from the D-League and Europe looking for one last shot, is not conducive to real NBA success.
To determine if there was any relationship between one's Summer League statistics and their NBA career, I did a linear regression of the most commonly cited box score statistics: points, rebounds, and assists. While linear regression sounds like a fancy term, all that it entails is finding the relationship between one independent variable (Summer League statistics) and one dependent variable (NBA statistics).
The result of a linear regression is often a correlation coefficient. Simply put, this is one number that outlines the relationship between the two variables. The correlation coefficient is always between -1 and 1, with -1 representing a perfect negative relationship (as one variable increases, the other decreases), 0 representing no relationship at all, and 1 representing a perfect positive relationship (as one variable increases, the other decreases).
For example, if Summer League points per game had a perfect positive relationship with NBA points per game, you would find that the higher one's Summer League points per game was, the higher their NBA points per game was, without fail. Obviously this is not true, but the point of the exercise is to determine if there is any relationship at all.
To do this, I limited the study to first round picks from 2000-2013 during their rookie year, or first Summer League experience. This eliminated all second round picks and any summer league performances by players who already had NBA experience. I also limited the sample size to players who played at least 15 minutes per game and participated in at least four games. This eliminated players who may have played just one great Summer League game.
Points Per Game
For points per game, the correlation coefficient was 0.30. This indicates a weak relationship between Summer League points per game and NBA points per game, meaning the two are essentially unrelated. Every year there seems to be at least one unheralded player who scores in bunches during the Summer League and then drops off the NBA map. While the reasons for this are just speculative, the graph below shows just how empty Summer League scoring can be.
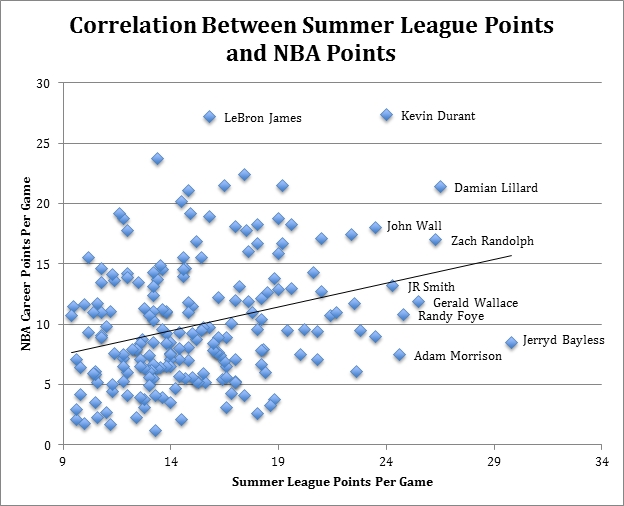
Included in the top five in Summer League points per game among first round rookies were Jerryd Bayless, Randy Foye, and Adam Morrison. Further, of the 22 rookies to average more than 20 points per game in the Summer League, just six have a career scoring average above 15: Damian Lillard, Kevin Durant, John Wall, Zach Randolph, Jason Richardson and Kevin Martin. The lesson here: don't fall prey to gaudy scoring in the Summer League.
Rebounds Per Game
For rebounds per game, the correlation coefficient was 0.55. This indicates a moderate relationship between Summer League rebounds per game and NBA rebounds per game.
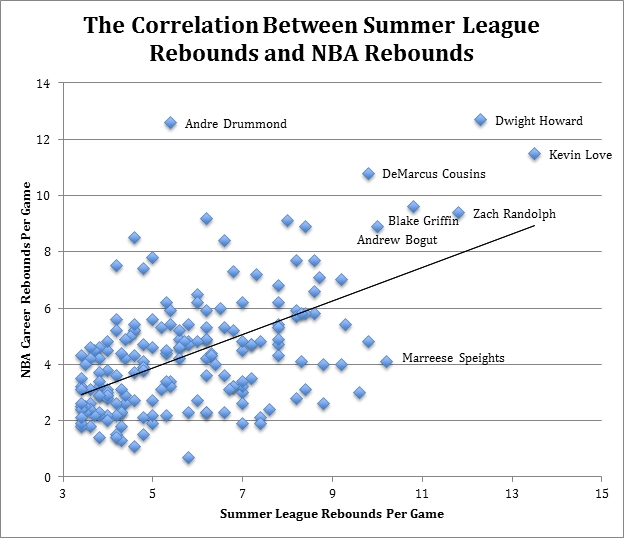
Rebounds are typically considered a skill that transfers well from college to the NBA. Therefore, a moderate relationship between rebounds per game in Summer League play and rebounds per game in the NBA may make some sense. In the graph above, six of the top seven in Summer League rebounds per game were Kevin Love, Dwight Howard, Zach Randolph, Blake Griffin, Andrew Bogut, and DeMarcus Cousins. Each of those players has continued to rebound at a high level in the NBA, with their career rebounds per game number all at 8.9 or above. However, a few elite rebounders, heavily influencing the relationship, may skew the results. Thus, unless a rookie puts up elite rebounding numbers in Summer League, his NBA rebounding numbers are likely more unpredictable.
Assists Per Game
For assists per game, the correlation coefficient was 0.64. This indicates a moderate to strong relationship between Summer League assists per game and NBA assists per game.
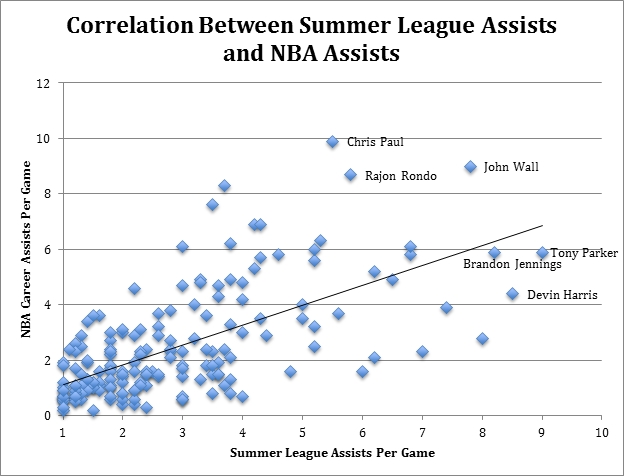
As seen in the graph above, many of the league's top assist men also put up big assist numbers in the Summer League. In fact, Jrue Holiday is the only player in the sample who has averaged more than 5 assists per game in his NBA career while averaging less than 3.5 assists in the Summer League. For fans of the Minnesota Timberwolves or Kris Dunn, his playmaking ability in Summer League could be a real glimpse of his NBA potential.
Ten NBA Summer League Facts
1. Only two rookie 2nd round picks have averaged a double-double in the Summer League: Lawrence Roberts (2005 No. 55 pick) and Branden Dawson (2015 No. 56 pick). Neither has recorded a double-double in the NBA.
2. In 2003, three rookie first round picks averaged more points per game than LeBron James: Carmelo Anthony (No. 3 pick), Zarko Cabarkapa (No. 17 pick), and Josh Howard (No. 29 pick).
3. No rookie No. 1 overall pick scored more points per game than John Wall's 23.5 in 2010.
4. No rookie No. 1 overall pick scored fewer points per game than Derrick Rose's 9.5 in 2009.
5. Josh Akognon, a 5' 11 26-year-old point guard averaged 41.9 points per 40 minutes in the 2012 Summer League, the highest rate ever.
6. The No. 7 overall pick, Ben McLemore did not have a single assist in over 150 minutes of play as a rookie during the 2013 Las Vegas Summer League
7. Byron Mullens averaged just 2.6 rebounds in 20 minutes per game as a 2009 rookie the fewest for any 7-foot rookie in the Summer League. Kristaps Porzingis averaged just 3.3 in 21 minutes per game during last season's Summer League, but proved to be a much stronger rebounder as a rookie (10.2 per-40).
8. Olden Polynice, drafted No. 8 overall in 1987, played 5 games in the 2004 Summer League at age 39. He had a PER of 7.1.
9. Lou Williams averaged more than 6 turnovers per game in both the 2006 and 2007 Summer Leagues. Eric Bledsoe is the only other player to average that many turnovers.
10. DeSagana Diop played in the Summer League 7 times and shot 33% from the field or worse every time. DeSagana Diop played 12 seasons in the NBA.


Comments