Statistics are an important measure used by NBA teams to assist in evaluating prospects. When scouting players, it can be helpful to examine the stats to see if they back up your observations of a player on the court.
The shooting guards compose the second look at the statistical break down of the 5 positions, and the top 20 at each position will be included. Unfortunately, it is impossible for us to include international stats in this breakdown, thus Rudy Fernandez, Marco Belinelli, Brad Newley, and Renaldas Seibutis have been excluded from this comparison.
Before looking through the following piece, it may be helpful to first examine the DraftExpress Stat Legend composed by Noah Libby-Haines to gain a better understanding of the statistics used.
All the applicable stats have been changed to account for pace of play and adjusted to 40 minutes to provide an equal ground to compare players. Keep in mind that level of competition, a players role in his teams system, and age differentials (ie: freshman vs. seniors) mean that these numbers always have to be taken with a grain of salt.
Interested in making your own statistical comparisons? You can do so here.
Points Per Game
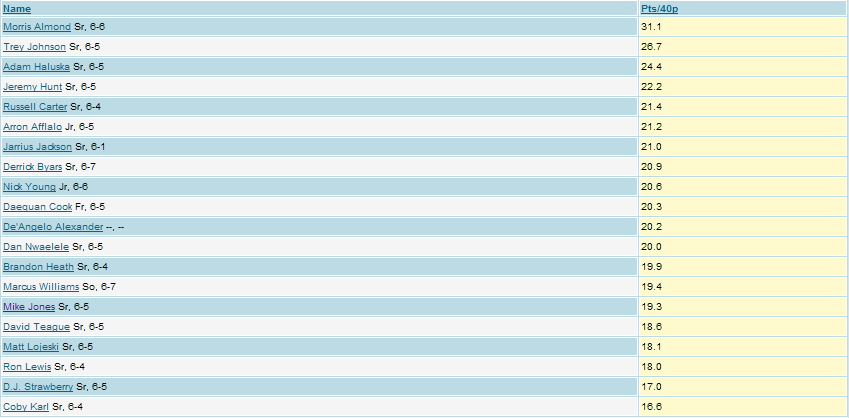
Morris Almond finished the season ranked third in points per game, but tops the chart here by an impressive margin when the numbers are adjusted to account for minutes and pace of play. Daequan Cook benefits from the adjusted numbers with his scoring average ranking in the middle of the pack. Trey Johnson's scoring average actually decreases when adjusted for pace, though he still ranks second on the list. D.J. Strawberry did not stand out as an incredible scoring threat at Maryland despite the opportunities he had in that system, although he does make up for his shortcomings on the defensive end.
Points Per Possession
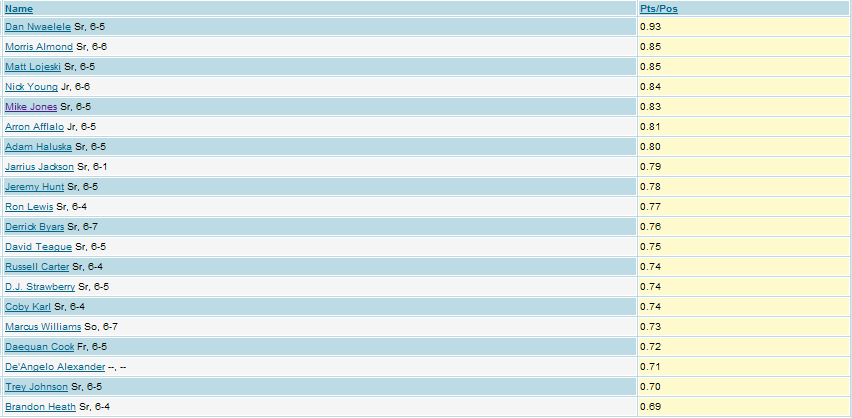
This stat measures the overall efficiency of a scorer on the offensive end, and can be very useful when evaluating shooting guards. The players who rank towards the top here all shoot a good percentage from behind the three point line, with Air Force shooter Dan Nwaelele toping the list. Air Force runs a very deliberate offense designed to wear out defenses and find optimal looks on the perimeter, and Nwaelele did an exceptional job at knocking down shots. Most of the guards near the bottom of this list have earned the reputation of being 'streaky' from behind the three point line. Its impressive to see Morris Almond both score at the rate he did and do so so efficiently despite having entire defenses geared towards stopping him. Nick Young gets high marks as well for combining fantastic athleticism with solid efficiency, despite the high degree of difficulty of many of the shots he takes.
Free Throws Attempted Per Field Goal Attempt
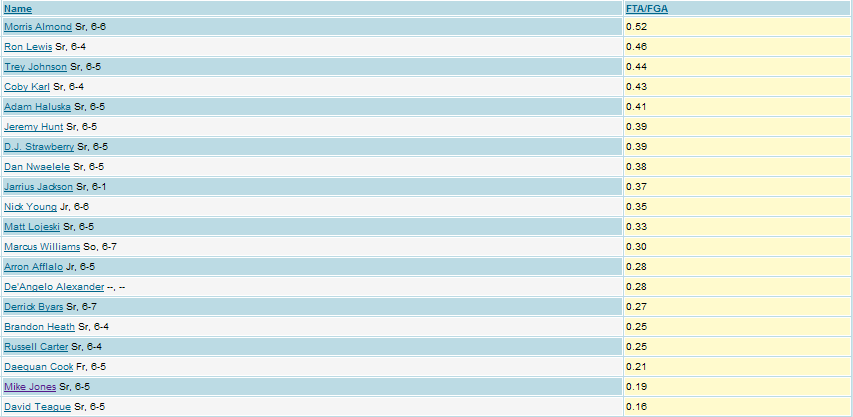
This stat can be effective in measuring which guards decide to attack the basket frequently rather than settling for outside jump-shots. Surprisingly, Morris Almond again ranks atop the list, though he projects by many as a shooting specialist at the NBA level. This has a lot to do with the amount of strength he possesses and the way he utilized it impressively playing in Conference USA. Jeremy Hunt and Coby Karl were also known as shooters on the offensive end in college, and their position towards the top of the list is also rather surprising, even if again we need to account for level of competition playing in a mid-major conference. Ron Lewis athleticism is duly noted in his placement on this list, despite playing in the rugged Big 10. The players on the bottom of this list all need to improve their ball handling ability, athleticism, toughness, shot-selection, or a combination of the four to become more effective as slashers.
Three Pointers Made
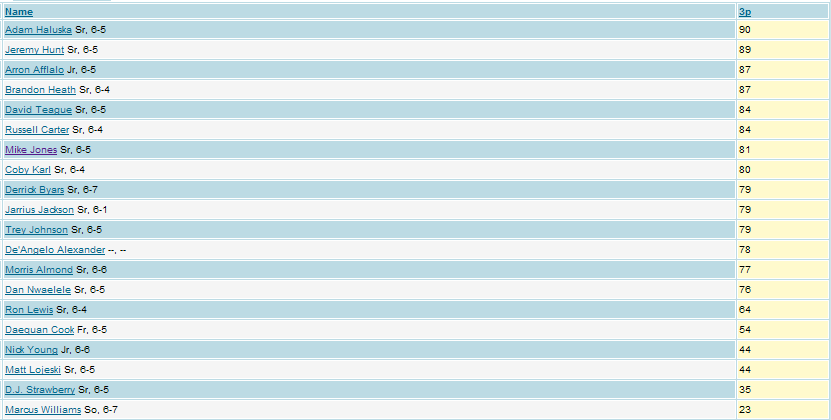
On the season, Adam Haluska made more three point attempts than any other shooting guard on the list. The former Iowa senior took a high volume of attempts and was known for his streakiness from the three point line, although he can certainly deliver in bundles when he gets hot from behind the arc. Marcus Williams is clearly more of a mid-range threat than he is a three point shooter, as he made less than 1 per game on the season.
Three Point Field Goal Percentage
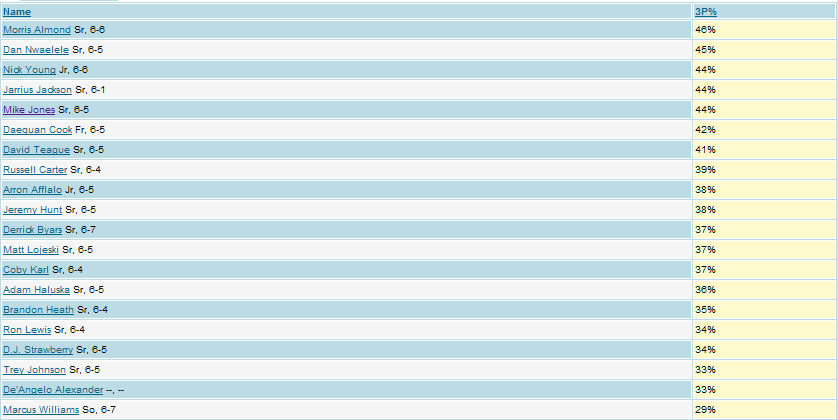
As the #1 (and probably #2) option at Rice, Almond managed to keep his three point field goal percentage at over 45% on a large number of shots. Nick Young created his own shot frequently, but also managed to keep his 3 point percentage towards the top of the list. Marcus Williams and Trey Johnson rank towards the bottom of the list here, and both were volume scorers for their team this season.
Effective Field Goal Percentage
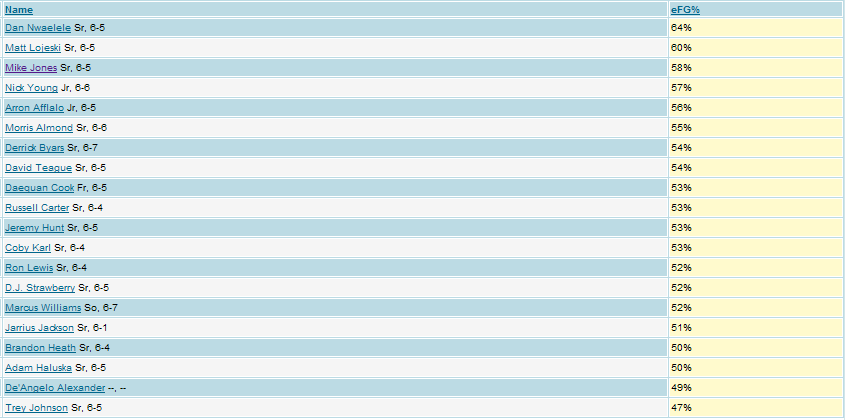
Effective Field Goal percentage was created by Mike Dunleavy to measure the percentage difference in value between two point and three point shots. This stat generally rewards players who shoot a high number of three pointers. Nick Young ranks towards the bottom of the list in 3 pointers attempted, and his ranking towards the top of this list shows his overall efficiency from the field this season. Dan Nwaelele 64% EFG is extremely impressive even when considering the system he played in. Matt Lojeski can be considered the first player on this list who has already made it as a pro after having signed with a team in First Division Belgium, but he does have an NBA out clause should an offer arise.
True Shooting Percentage
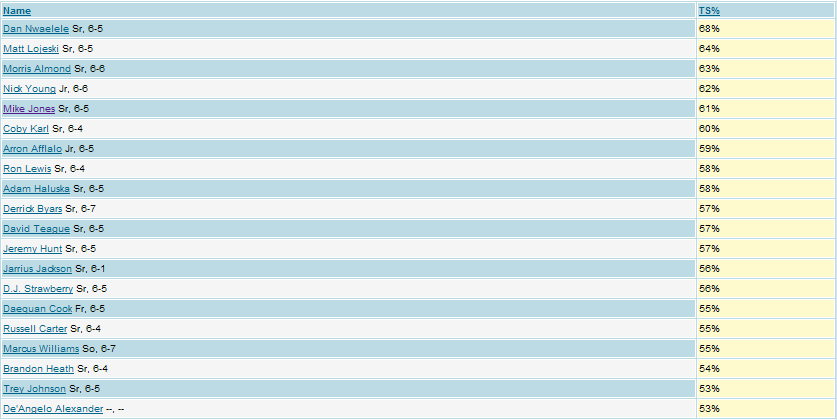
Created by John Hollinger, True Shooting Percentage was designed to measure the all around efficiency of a scorer. It can be calculated by using the formula: TS% = Pts/(2*(FGA + (.47*FTA). As we have seen on some of the other efficiency lists, Dan Nwaelele from Air Force leads the way. The players known for smart shot selection rank towards the top, while many of the gunners are found on the bottom.
Turnovers Per Game
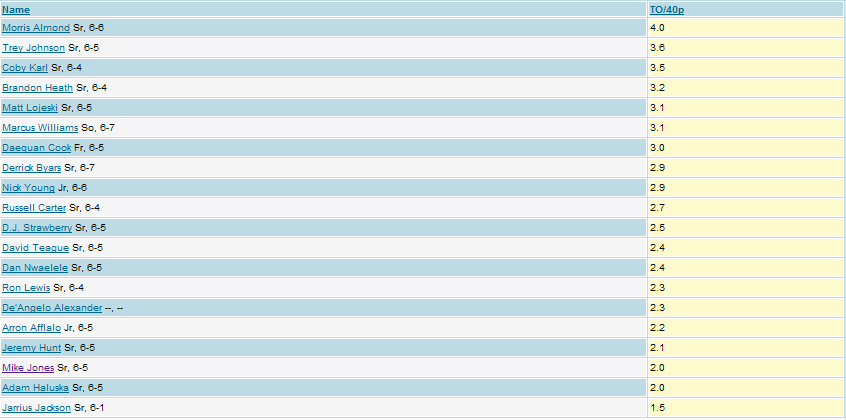
Morris Almond leads the shooting guards in number of turnovers per game, which isn't too surprising considering his role at Rice coupled with his average ball-handling ability. Jarrius Jackson took care of the ball incredibly well for how often he handled the ball, a testament to Bob Knights coaching and Jacksons own ability to play within his limitations. Guys like Jackson, Afflalo, Haluska and Jones also dont turn the ball over that much because they just dont put the ball on the floor as often.
Turnovers Per Possession
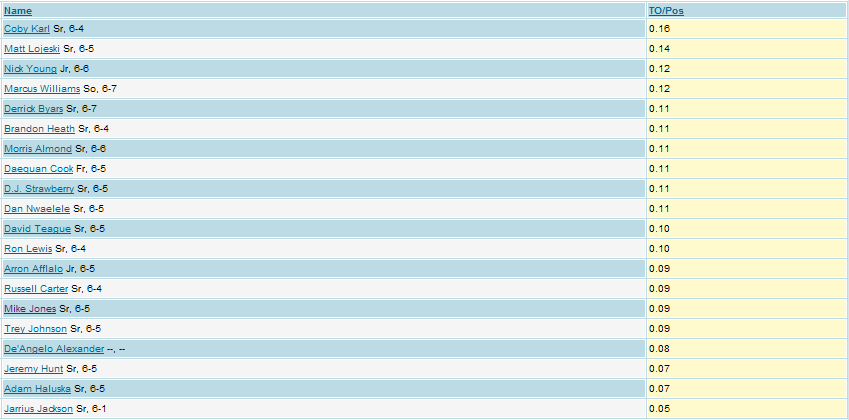
This stat looks at the ratio of turnovers per possessions used, and can be valuable when determining which players are most prone to playing out of control. Despite solid passing instincts, Coby Karl ranks at the top in this category. Nick Young creates his own shot often, and we see his name towards the top of the list as a result, though the yield of turnovers isn't so high with another pair of scorers in Morris Almond and Daequan Cook.
Assists Per Game
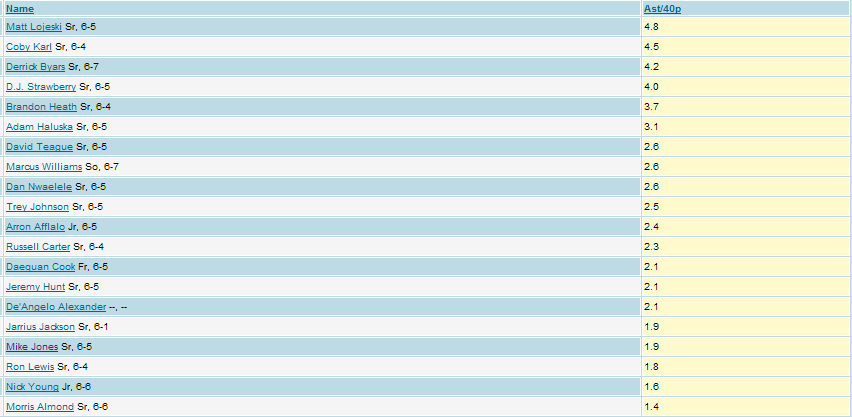
The extremely crafty Hawaii senior Matt Lojeski leads this years shooting guard class in assists per game, followed by Coby Karl, who spent his time at the Orlando Pre-Draft Camp playing point guard. D.J. Strawberry has also proven to be a good passer, and spent last season playing the lead guard spot for Maryland. Derrick Byars also put up some very impressive assists numbers this season in Vanderbilts Princeton Offense. Most of the guards towards the bottom can be noted as the purest scorers in the class.
Assist To Turnover Ratio
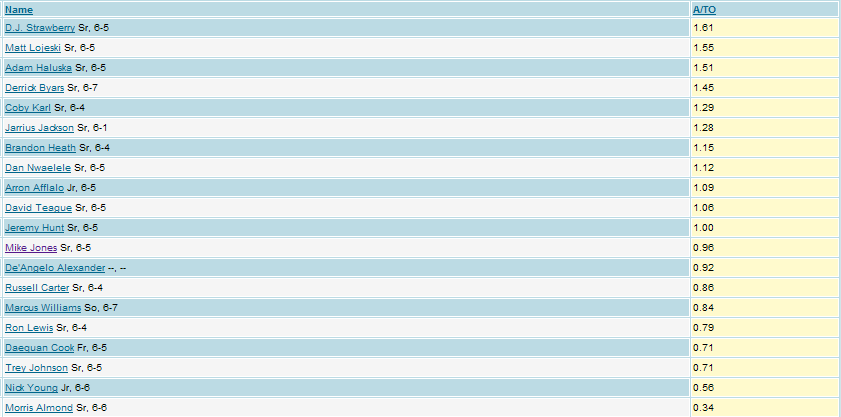
This stat helps determine who makes good decisions with the ball, and it makes perfect sense to see a former point guard in D.J. Strawberry at the top. Derrick Byars has a good ratio for somebody known as a pure scorer, while Morris Almond and Marcus Williams appear to be more effective touching the ball with their sole purpose as scoring.
Player Efficiency Rating
Player Efficiency Rating, also created by John Hollinger, was designed to measure the overall statistical effectiveness of each player. PER may not be the best stat to use to compare college players, however, as it does not distinguish between level of competition, as Noah Libby-Haines explains.
Towards the top of the list, we see the more efficient guards who were primary scorers for their team this season. Versatile players such as Adam Haluska and Matt Lojeski get a nice boost. The shooting guards who scored on a high volume of attempts (and didnt contribute much as rebounders or passers) generally rank towards the bottom here.
Efficiency
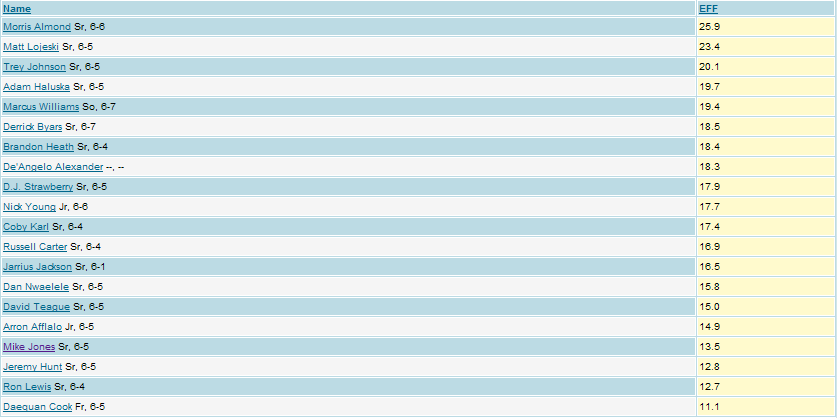
Efficiency is a calculation generated by the NBA to determine the statistical effectiveness of a player. They use the formula EFF = ((PTs + ORs + DRs + Stls + Asts + Blks): ((FGA: FG) + (FTA: FT) + Tos))/g to compute this statistic. This graph looks to be a good summary of the top contributors for their teams this year, with Morris Almond at the top thanks in large part to his scoring efficiency and Daequan Cook at the bottom due to his lack of versatility and marginal production.
Efficiency Per 40 Minutes
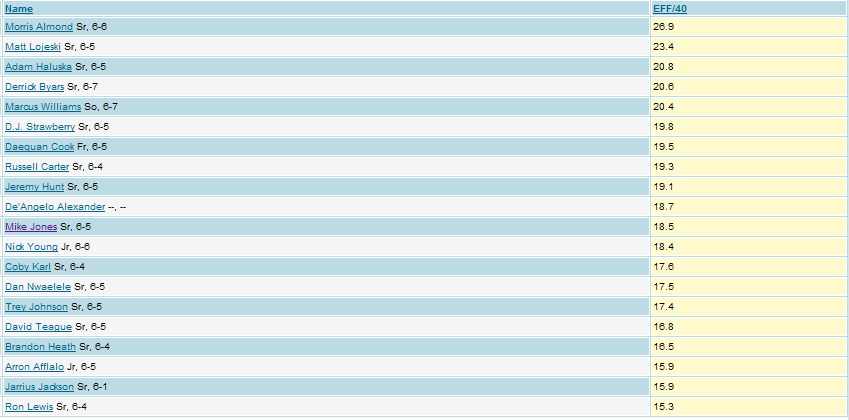
The traditional EFF statistic measures what is produced by a player, while the EFF per 40 measures the same statistics while taking minutes into consideration. This allows for the evaluation of potential while looking at a players' all-around contribution. As a result, Daequan Cook moved from the bottom of the normal EFF list to the top third when adjusted for 40 minutes.
Win Score per 40 Minutes
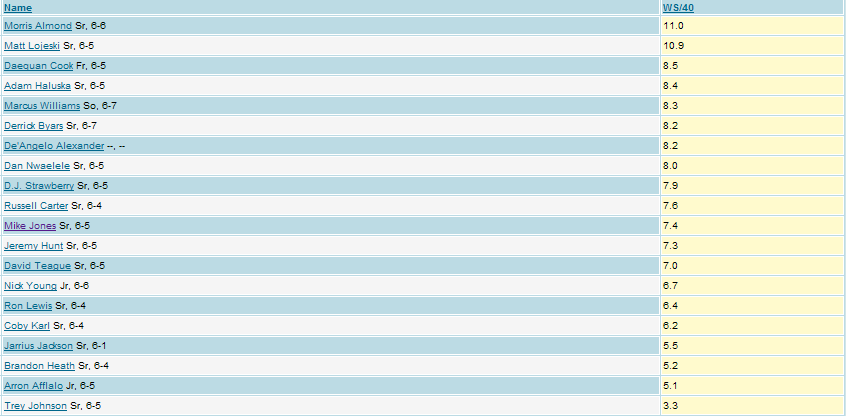
Win Score is a stat recently added to our database at DraftExpress, and was created by David Berri, author of the book The Wages of Wins. The statistic is calculated using the formula: PTS + TRB + STL + .5* BLK + .5*AST - FGA - .5*FTA - TO - .5*PF / Min * 40. Completing the knockout punch for this article, we once again find Morris Almond at the top of this list. It will be fascinating to see how his numbers translate to the pros. We definitely need to study more tape of his to make sure we arent missing out on one of the sleepers of this draft. Trey Johnsons numbers look very disappointing in this stat.


Comments