

")

Part One
Intro:
Theories about proper NBA draft strategy may well outnumber the available players for next Thursdays festivities. When deciding between two players rated similarly, a GM may drop back to the adage you cant teach size and scoop up that raw 7-footer over the skilled but undersized point guard. Always in the backdrop of draft day decisions is the overarching debate whether to draft for need or for overall potential.
An organizations present and future prospects affect whether they are drafting for current impact, and therefore looking for a mature ready-to-help player, or are seeking a long-term, and perhaps delayed, benefit. Meanwhile, the detritus of the Collective Bargaining Agreement looms over all player personnel concerns. Salary cap and luxury tax issues have led some teams to pretty much leave first draft picks on the curb with a sign No reasonable offer refused. Alternately, the lets draft an international player and let him germinate overseas for a couple years strategy comes into play in the late first round, becoming an omnipresent force in the second.
For the purposes of this article, we weigh in on some of the merits of these strategies, by bringing together observations we have made in a series of past articles that examined outcomes of the NBA draft from a number of different perspectives. We have updated previous analyses with data through the current year to account for recent trends. We hope to present likely outcomes for any particular pick with regards to his draft slot, position played, and domestic vs. international player status. We also attempt to chart some guidelines for the probable course of draftees NBA careers.
As with any set of rules, exceptions abound and will immediately spring to mind. However, knowing the rarity of finding an international player the caliber of Manu Ginobili in the second round, or a Josh Howard near the end of the first round, may help set expectations at a more reasonable level. Let these guidelines temper your expectations just a bit when your team drafts the apple-of-your eye next Thursday.
Methodology
In many of our past articles we have used a partially subjective system to divide players into categories of performance. For the present analyses we attempted to make these rankings more objective. All players seasonal production was coded using seven primary categories which were then collapsed into the following four categories:
I. Out of the league (category 1) & Barely in league/End of bench guy (2) No games played (1) or played less than 100 minutes for the season or less than 10 minutes per game (2).
II. Solid bench player (3) & Top bench player/Marginal starter (4) Played more than 100 minutes in the season, and more than 10, but less than 20 minutes per game (3) or more than 20 but less than 30 minutes per game, OR played 30 or more minutes per game but had a year 5 PER below 10 (4)
III. Solid starter (5) Played 30 or more minutes per game and had a PER between 10 and 17
IV. Star: All-Star caliber player (6) & Superstar (top 10-15 player in the league) (7)- 30 or more minutes with a PER between 18 and 20 (6) or a PER of 21 or greater (7)
A few notes about the rankings: When referring to five year outcomes in several of the rules below, we accommodated for a player being lost to injury in their fifth year by using their fourth year outcome data. We tested several different performance metrics when creating the current ranking system, but found the above combination of minutes and PER to best match our previous (admittedly subjective) rankings.
Seventy-seven percent of players received the same rating under the old (subjective) and new (objective) system among the four groups, while 99% were within one category of the subjective rating system.
Using PER, or any objective measure, diminishes the ratings of some players (e.g., that defensive demon whose offensive production is secondary to team success) when compared to how we, and most other NBA observers, would view them and elevate others (e.g., Team success is not getting me that max contract!).
We do not agree with how all players are currently categorized, but our previous subjective ratings are obviously not unassailable either. We feel we have done our best here to incorporate objective measures into our analyses while maintaining basic face validity.
So with no further ado, here are the last four Rules for Draft Night Success:
Part Two Continued:
IV. The Second Round: May Be Time to Catch That Nap
Many NBA GMs have seen a desired player fall into the second round, and into their laps, for mysterious reasons. GMs also regularly mine the second round looking for that hidden gem who will prove once and for all their superior drafting acumen. However, in reality there have been exactly seven stars (at season five) of the 632 players drafted in the second round over the 24 drafts between 1980 and 2003: Gilbert Arenas, Carlos Boozer, Doc Rivers, Mark Price, Michael Redd, Mehmet Okur, and Toni Kukoc. There were three more players whose production was more fleeting (and star somewhat more questionable) who fell briefly into the star category: Hotrod Williams, Michael Williams, and Cedric Ceballos.
Even when the somewhat later bloomers (at least in terms of star production) like Manu Ginobili, Danny Ainge, Rashard Lewis -- and some others that just missed the cut in this scoring system, for whom arguments could be made (e.g., Cliff Robinson, Jeff Hornacek, and Nick Van Exel) -- are accounted for, you would be hard pressed to get the number of second round stars up to 20 across these 24 years. In short, there may be a star lurking somewhere in this years second round, but good luck finding him.
Even if you are just looking for a solid contributor in the second round, you have your work cut out for you. Five years after the draft, second rounders are more likely to be sitting at home watching basketball on television than to be contributing to an NBA team: 30% of second rounders never played in an NBA game, while 68% are out of the league within five years.
V. Think Twice Before Spending that Pick on an International Prospect
In recent years GMs have increasingly been investing their picks in European prospects that they know will not immediately matriculate. Particularly those GMs who have good personnel today and salary cap issues to fight figure that if they pick an international they can save money today and get a good player in a couple of years once their needs are more immediate. An intriguing and crafty strategy: sadly, more often than not, it fails. Many international prospects never set foot on American soil. And of those who do, there are just as many Darkos as Manus.
(Note: We define international players to be those who on draft day have not played high school or college basketball in the US. Were talking about Ben Pepper, Yi Jianlian, Pau Gasol, and Arvydas Sabonis, not Patrick Ewing or Dikembe Mutombo.)
International players, once drafted, are less likely to play in the NBA than are their domestic counterparts. There have been 134 international players drafted in the thirteen years since 1995 (when international drafting started to heat up). Fifty-three of those players (40%) are still on layaway for NBA teams. Taking three years as a reasonable waiting period for eventual player appearance (i.e, considering the drafts only from 1995 to 2005), lowers the figure slightly to 32% (34 of 105). Essentially all first round draft picks (domestic or international) see time in at least one NBA game. However, two recent international first rounders have yet to join the NBA: Frederic Weis (1999 we still hear the echoes of Knicks fans booing) and Fran Vazquez (2005). While Vazquez is apparently looking to join the NBA next year, Weis will never cross the Atlantic.
The second round is where the roulette wheel really starts spinning (Table 1). In the years from 1995-2005, 191 of the 261 domestic players drafted in the second round (73%) played some time in the NBA. However, for international players that percentage is reduced significantly: of the 60 second round international draft picks, only 28 (47%) have ever played in the NBA. And that international player that your team picked at the bottom of the second round? You might as well become a fan of international hoops, because the likelihood that he ever plays for your team is slim.
With the growth of basketball talent throughout the world, perhaps the influx of international players will continue to see an upswing in coming years. However, the increasing financial strength of foreign leagues, now often able to offer players who would receive minimum level NBA contracts more money, significantly reduces the attraction of the NBA for many of these players.
Table 1: Percent Drafted Players from 1995-2005 who Ever Play in the NBA
However, many believe that those international players who do matriculate are worth the wait: Ginobili clones bursting fully grown into the NBA. Alas, international players do not actually experience any greater rates of success than do domestics. Considering only players who have played at least one game in the NBA through the 2003 draft year (to allow for the 5-year outcome window), reveals that 48% of international players are out of the league or just hanging on five years after draft day (compared to 43% of domestics). Meanwhile, 32% are solid bench players to marginal starters (compared to 35% of domestics) and 20% are solid starters or better (compared to 23% of domestics). This finding holds even when controlling for the quartile in which players are drafted.
So next time you think about the careers of international prospects like Yao Ming, Tony Parker, or even recent lower profile entrants like Luis Scola and Juan Carlos Navarro, remember too Efthimios Rentzias, Antonis Fotsis, Mirsad Turkcan, and the scores of names that you will never see in an NBA box score..
VI. Early Performance is No Indication of Future Success
It is only natural to leap to judgment. If a highly lauded prospect has a weak rookie year, there is a pull to declare him a disappointment and look for the next golden child. And if an entire draft class (take the class of 2006 for example) is slow out of the gate, we write them off as weak and eagerly look toward the next crop of prospects to spice things up again. However, time and time again it is proven that predicting a players (or classs) success based upon only a year or two of NBA experience is an inexact science at best. It takes several years of growth and development to really know what a player has to offer.
Correlation analyses of player performance indicators (such as PER and NBA Efficiency) show that first and second year performance are only moderately correlated with performance in years five through ten (correlations are generally in the .30 to .40 range). However, performance in year five is a strong predictor for the following five years of play (with correlations in the .65 to .70 range throughout). All Star players who had weak to middling rookie efforts include Dirk Nowitzki, Scottie Pippen, Gary Payton, and John Stockton.
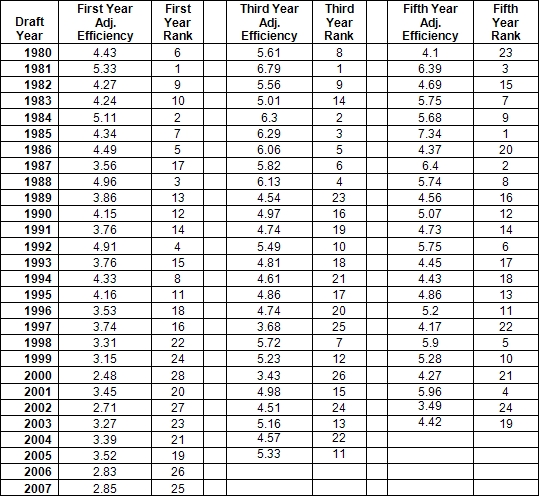
As with players, so with entire draft classes. The overall production of a class in its rookie year does not necessarily predict how that class will shape up in year five. As you can see in Table 2 below, there is substantial movement among several of the draft classes: some that appeared very weak in year 1 are much stronger in year 5 (1987 [partly due to David Robinson not playing until 3 years after the draft due to his military commitment], 1998, 1999, and 2001) and conversely, some that started out strong faded substantially by the fifth year after the draft (1980, 1986, 1994). (For a full explanation of our adjusted efficiency metric, see Will the Draft Class of 2006 Please Stand Up?)
So withhold judgment on your GMs draft wisdom for a few years before doling out a final grade; many of the raw talents that enter the NBA need time to find their true performance level.
VII. Be Thankful that You Are Not the Atlanta Hawks (and if you are, our condolences)
The Atlanta Hawks are by far the worst drafting team in the past three decades. Even when they get it right, they get it wrong. Of the 24 first round picks they have had from 1980 to 2003, only one (Pau Gasol) became a star (the star label as applied to Gasol may be a sensitive topic in Los Angeles this week), and they immediately traded his rights away (along with Brevin Knight and Lorenzen Wright) for Shareef Abdur-Rahim. Their top 10 picks beside Gasol in those 24 years were Al Wood, Keith Edmonson, Jon Koncak, Rumeal Robinson, Stacey Augmon, Adam Keefe, Jason Terry, and Dermarr Johnson. Thank goodness for Augmon and Terry, but the rest, well, not what a GM dreams of getting with his coveted lottery picks. Among the other 15 drafted players in that era only Kevin Willis, Alan Henderson, and Boris Diaw distinguish themselves. Nearly half the players that Atlanta has drafted (46%) are out of the NBA or buried deep on NBA benches after five years.
The two bright spots in the Hawks draft record were the post-draft acquisition of Dominique Wilkins in 1982, and the 1983 second round extraction of Doc Rivers. Hawks fans can also point to the post-2003 draft talent and say that things are changing in Atlanta. With six first round picks in the past four drafts, Atlanta has acquired Josh Childress, Josh Smith, Marvin Williams, Shelden Williams, Al Horford, and Acie Law. Smith and Horford could end up being among Atlantas best picks in the past 30 years (although not really a Hall of Fame distinction). The cynic would retort that with picks 2, 3, 5, 6, 11 and 17 you had better end up with some serious talent. And when you could have had a backcourt of Chris Paul (or Deron Williams) and Brandon Roy instead of forwards Marvin and the now departed Shelden Williams, maybe you dont have that much to crow about.
Fortunately for Atlanta fans, there will be no missteps this draft day, as their first round pick is being conveyed (perhaps mercifully) to Phoenix as part of the Joe Johnson sign and trade.
VIII. If All Else Fails, Buy a Time Machine
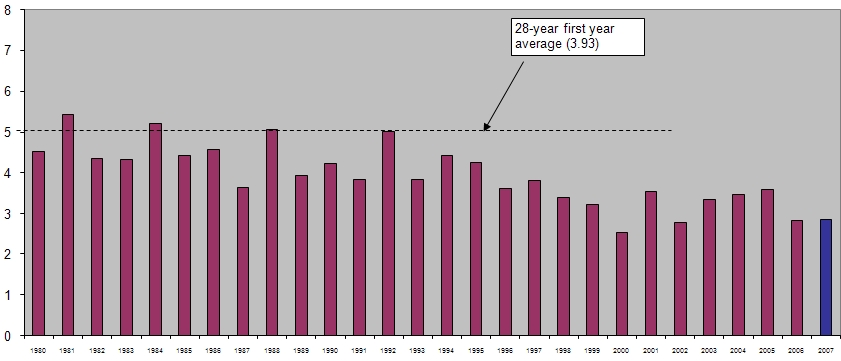
Overall player performance in the first five years after the draft has dropped notably in the last decade. The drafts of the 80s and 90s saw significantly better player production five years out than have those of the past few years. And the past two years have seen historically bad first and second year production. The draft classes of 2006 and 2007 have given us some of the worst production of any rookie and sophomore class in the past 20 years. The vaunted draft class of 2007 ran neck and neck in first year production with the much maligned draft class of 2006. In fact, every draft class in the past ten years has performed more poorly in overall first year production than did any class in the 1980s.
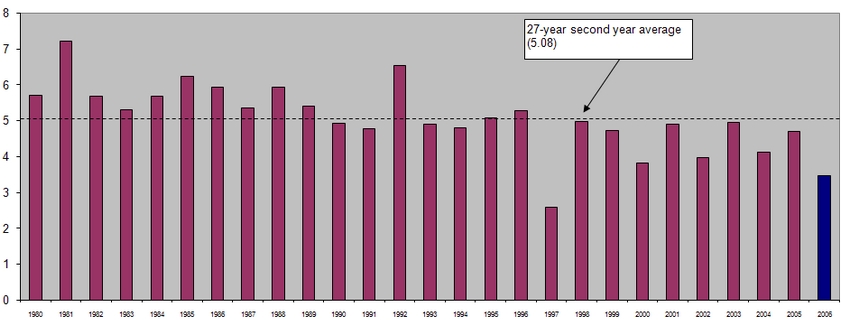
To add insult to injury, 2006s sophomore effort was the second worst in 27 years. Only the class of 1997 offered up worse aggregate performance than the class of 2006.
It is as yet unclear what has led to the significant drop in player production in recent years. It is possible that there is less opportunity for young players as teams increasingly rely on veterans who are playing longer and international free agents who can fit some roles more readily than neophytes. Only time will tell whether this trend continues into the future.
Conclusion
Few things are more exciting to a GM (or to those of us who like playing the NBA GM Home Game) than when a player they target beats the odds and excels beyond reasonable expectations. In this article, we have merely outlined some of the reasonable expectations gleaned from the last three decades of NBA drafts. Imitating strategies which have paid off big in the past will never cease to be tempting; all businesses to some extent turn toward successful models for inspiration. However, sometimes the successful strategy was a long shot and its replication a false promise.
Even when well aware of the odds, talent evaluators (pro and amateur) will still fall in love with a guy whose specs do not add up, but has some attractive intangible. During last years draft night, one of this articles authors twice decried that his beloved Celtics had erred in passing over Josh McRoberts (a big man sure to beat the odds!), first for Gabe Pruitt and then for Glen Big Baby Davis. Although, as we know, it is much too early to evaluate this pseudo-scouts judgment, we are just as glad that Danny Ainge was the guy in control on draft night.
*Adjusted Efficiency = [((Pts + Reb + Asts + Stl + Blk) - ((fga - fgm) + (fta - ftm) + turnover))*(92.4/lgpace)]/#draftslots/#games.
Lgpace = Average pace of the NBA for each year as reported by basketball reference.com
#draftslots = number of first and second round draftees in a given draft year
#games = number of possible games in a year (82 for all years except the strike year of 1998-99)
Note: Data for this article was compiled from NBA.com, Basketball-Reference.com, NBADraft.net, DatabaseBasketball(2.0), and TheDraftReview.com. The authors would like to thank all those involved with developing and maintaining those resources and making them available for public use.


Comments