-Situational Statistics: the 2012 Big Men Crop
-
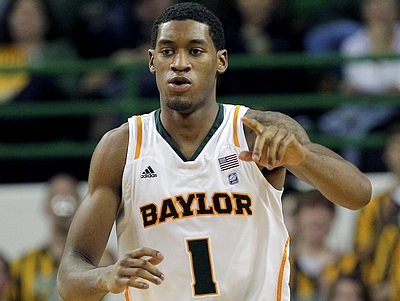
Perry Jones is the highest ranked prospect in this weak forward group, but looks average at best overall from a statistical perspective. His 0.964 overall points per possession ranks right in the middle of the group at 8th overall, despite doing it on the fourth fewest number of possessions per game at 13.6. Jones' efficiency is certainly hurt by getting to the free throw line on just 11.2% of possessions, which ranks second worst in the group, but his 49.0% FG% also ranks in the bottom half.
Jones has a pretty average distribution of possessions across various situations, ranking towards the middle in the percentage of possessions he gets with cuts, jump shots, offensive rebounds, post ups, spot ups, and isolations, and just really hurts himself by having average to below average efficiency in nearly every area.
The biggest bright spot for Jones is his finishing ability on cuts, something that accounts for an average 14.9% of his possessions and is unsurprising given his outstanding physical tools. Jones' 1.254 PPP on cuts ranks 4th of the group and is a somewhat encouraging sign for him projecting forward, as this is likely something he'd be expected to do more off at the next level.
Jones also did stand out by having the highest PPP of any player on transition possessions at 1.571, but did so on just 1.1 possessions per game, second lowest in the group. Baylor played at just the 142nd fastest tempo in the country this year according to kenpom.com, so Jones could see more opportunities here if he's drafted into an up-tempo situation.
The simplest thing Jones could improve on in the short term is cleaning up his inconsistent jumper, as jump shots account for 34.3% of his shot attempts (3.5 shots per game), and he's only hitting for 0.798 PPS, 4th worst in the group.
Jones' problems creating his own shot are more concerning, as despite his intriguing flashes, his efficiency in isolation and post-up situations are very poor. His 0.654 PPP on isolations ranks 4th worst, while his 0.795 PPP on post ups ranks second worst overall, and dead last among NCAA players.
-Terrence Jones ranks similarly average across most categories in this grouping, while his 0.975 PPP ranks just one spot ahead of Perry Jones at 7th overall. Terrence Jones also used a low number of possessions per game at 12.9, third lowest in the group, but this is more a case of being on an absurdly talented team than anything else.
The biggest area Jones stood out in this past season was probably with his isolation game, where his 0.917 PPP ranked fourth best of the group. Playing more of a clear-cut power forward role this season, Jones was able to more consistently take advantage of his speed in mismatch situations, something that bodes well for his chances as a face-up four at the next level. He only used isolations for 11.6% of his possessions (sixth most in the group), again partly by consequence of being on such a talented team, so he has some room for growth here. His strong efficiency also came in spite of turning the ball over on 20% of his isolation possessions (fourth most in the group), so there's some clear opportunity for improvement if he can clean up that area of his game.
Jones surprisingly didn't stand out at all as a finisher around the basket, where one would expect a player with his length, bulk, and athletic ability to. His 1.156 PPP finishing around the basket ranked just 8th in the group, and this is of huge importance for him given these accounted for 55.9% of his overall possessions, third highest in the group.
Looking more specifically into cuts and offensive rebounds paints an even worse picture, as his 0.912 PPP on put-backs ranked dead last of all 14 players, and his 1.088 PPP on cuts ranked fifth worst, with these two areas accounting for 31% of his total possessions combined. Jones actually has the strange distinction of having a higher efficiency on isolations than offensive rebounds, which probably isn't very common among 6'9 power forwards.
-Continuing the trend of top prospects not standing out, Quincy Miller also checks in with an unimpressive 0.939 PPP, ranking 9th overall. Miller's efficiency ranks average to below average in nearly every category, giving credence to the notion of him being a jack of all trades, master of none at this very early point in his development.
Miller's 1.022 PPP finishing around the basket ranks dead last among all players in this category, something he could improve on as he fills out his frame and gets stronger in the future. To be fair to him, Miller is probably the closest thing to a pure small forward of every player in this group, whereas most of the rest of them are combo-forwards and undersized fours, so it's somewhat expected for him to underperform in this area. Further, he's one of only two freshmen in the group, and is coming off a serious ACL injury from his senior year in high school, making him even further behind the curve than a normal freshman.
-Moe Harkless' 17.4 possessions per game ranks third highest in the group, which is not surprising given the oversized role the freshman had to play on his ineligibility and transfer ravaged team. Unfortunately for Harkless, his 0.867 PPP ranked near the bottom of the pack at third worst overall, though a good part of that is due to him playing a role he'd never be expected to play at the next level.
Still, digging deeper into the numbers doesn't unearth any obvious gems in Harkless' statistical profile, as he finished poorly on both jumpers (0.708 PPP, second worst overall) and finishing around the basket (1.133 PPP, fourth worst overall). Isolations accounted for 15.8% of his possessions, which was fourth highest, but his 0.784 PPP there ranked sixth, and this didn't contribute much to his overall low efficiency. Somewhat strangely, his 0.577 PPP on spot-ups and 1.0 PPP on cuts actually both ranked last overall among all players, which is very concerning for a player looking to translate to more of an off-the-ball role in the pros, though he could definitely benefit some from decreased defensive attention and being around better shot creating teammates.
-Royce White has the unfortunate distinction of ranking dead last among forward prospects with 0.806 PPP. His poor overall efficiency is due heavily to his likewise last-ranked turnover percentage, as he turns the ball over on a whopping 23.5% of all possessions, which isn't even close to the second worst player at 18.1%. White sees 25% of his possessions come in isolations, which is the highest of everyone, and that certainly doesn't help his turnover rate much. Still, his PPP on both isolations and post ups rank towards the bottom of the pack, and his 0.683 PPS on jumpers ranks dead last. White's oversized role and high portion of shots coming in isolations and post-ups don't help his efficiency much, but his 16 possessions per game was only fifth highest of the 14 players ranked, so it's hard to excuse his efficiencies being as low as they are across the board.
-Draymond Green's 0.91 overall PPP ranks fourth worst among forwards, though his 17.4 possessions per game ranks third highest. Green's 1.005 PPS on jumpers ranks fourth best, while he also sees the third highest distribution of jumpers, with 43.9% of his shots being of the jump shot variety. While Green fares well with his jumpers, he's on the opposite end of the spectrum finishing at the basket, where his 1.094 PPS and 28.1% shot distribution both rank third worst.
-Kevin Jones, the seventh highest ranked player on our big board from this group of forwards, is the first player on the list who actually comes out looking favorably when looking just at overall scoring efficiency. Jones' 1.068 PPP ranks fourth best, while he does it on the highest number of possessions at 17.8 per game. Jones also sees the fourth highest percentage of his possessions coming in the half-court (92.5% of them), which makes his overall efficiency slightly more impressive seeing how he isn't getting many easy lay-ups in transition.
Jones unsurprisingly benefits from having the highest distribution of possessions coming on offensive rebounding putbacks, where he sees an obscene 19.5% of his possessions, which easily ranks first among the group and dwarves second place Terrence Jones' 15.5%. Kevin Jones' 1.226 PPP on putbacks ranks fifth in the pack, and gives a big boost to his overall scoring efficiency.
-Jae Crowder leads all players in overall scoring efficiency with 1.14 PPP, being well ahead of second-place John Shurna at just 1.078 PPP. Crowder similarly holds the top scoring efficiency marks on spot-ups (1.237 PPP) and cuts (1.374 PPP), a good sign for someone hoping to catch on as an off-the-ball, hustle player in the pros.
Crowder sees 51.9% of his shots as jumpers, second highest in the group, and his 0.989 PPS on jumpers ranks fifth highest. Crowder's 1.338 PPS finishing around the basket also ranks fourth highest, speaking to his balance and ability to contribute from many areas of the floor.
-JaMychal Green stands out by being the second best finisher around the basket at 1.397 PPS, but does so on just 3.0 shots per game, fourth lowest in the group. His 1.32 PPP on offensive rebounds also ranks third best, though he fails to stand out in any other areas. He could potentially benefit from a smaller role at the next level where he can focus more on his strengths of just finishing near the rim.
-Mike Scott's 1.069 PPP ranks third best in the group, and he does so on a slightly above average 15.9 possessions per game. Scott posts above average efficiency marks nearly across the board, and stands out especially with his third-best 1.055 PPP on post-ups, while doing so on a second-best 5.7 possessions per game. Scott's 1.465 PPP on offensive rebounds also ranks first overall, and for good measure ranks third overall in both jump shot efficiency (1.015 PPS) and finishing around the basket (1.355 PPS).
-Eric Griffin has the strange distinction of having the highest field-goal percentage in the group at 60.4%, but his overall efficiency is dragged down by the fact that his free-throw percentage of 56.8% is lower than his field-goal percentage. Making matters worse, Griffin gets to the free-throw line on 21.5% of possessions easiest the highest in the group, which helps explain while his overall efficiency (1.0 PPP) ranks just sixth overall.
-John Shurna excels in a variety of statistical areas, as he boasts the second best overall scoring efficiency (1.078 PPP) on the highest shot distribution of 17.8 possessions per game. Shurna unsurprisingly sees the highest percentage of his shots on jumpers at 58.2% of the time, and impressively also ranks the highest on jump shot efficiency at 1.15 PPS. Shurna's catch and shoot efficiency of 1.36 PPS nearly doubles his pull-up jumper efficiency of 0.693 PPS, but probably wouldn't be a big deal given the expected role he'd play if he makes it at the next level.
-Mitchell Watt's 1.026 PPP ranks fifth overall on an average 15.5 possessions per game. Watt posts above average efficiencies in most areas, clearly benefitting from the weak competition he faced, highlighted most by his top-ranked post up scoring efficiency of 1.096 PPP. Still, Watt's sixth best PPS on jumpers (0.987 PPS) is encouraging for the late-developing forward.


Comments