


Fortunately, the disappointments of last season have not been revisited: the rookie effort of the 2008 draft class has been a ringing success. The 2008 draft has produced the most potent first-year class since 1995, when now NBA graybeards Kevin Garnett, Rasheed Wallace, Joe Smith, and Antonio McDyess entered the league. Players throughout the first round are playing meaningful minutes and contributing to teams from San Antonio to Sacramento. This draft class brings back memories of a time when Huey Lewis was a megastar and Supply Side Economics sounded like a good idea. We have seemingly rolled back the clock to the mid-80s, a time when rookie classes were real contributors - before high school players became draft-eligible and international ballplayers of mystery became the darlings of scouts everywhere.
In fact, as will be discussed in detail, the 2008 draft class is perhaps the most astonishing first-year class in the last three decades.
2007 vs. 2008: The Midseason Tale of the Tape
As is our custom, we first examined the relative performance of this year's draft class versus its immediate predecessor by dividing each draft into four distinct bands (top ten picks, eleven to twenty, bottom of the first round, and second round) and comparing them head to head. For each of the four draft categories, we assigned a winner to the 2007 versus 2008 rookie draft clash.
Top Ten Picks, 2007 vs. 2008: The prospects for the top of the 2007 draft class were obviously hindered by the pre-season loss of Oden due to surgery. They were also impacted to a lesser extent by Mike Conley's injuries. However, Kevin Durant and Al Horford had reasonably productive rookie years by the all star break (Table 1). Yi Jianlian and Conley (when he was playing), had a few very good games as well. On the other hand, picks 7 through 10 of the 2007 draft did very little in the first half of their rookie year.
Table 1: Top 10 Picks in 2007 and 2008 All Star Break Totals
In contrast, apart from Danilo Gallinari and Joe Alexander, the top ten picks of 2008 have been very productive. Eight of the top ten picks boast NBA efficiency scores in double digits (compared with only 4 rookies last year), with six of the eight scoring over 12.0. Last year only Durant and Horford attained that level of production. The only possible cause for disappointment in this crew is Beasley, who has failed to be as immediately explosive as some predicted. But his performance is critiqued largely as a result of the success of his brethren. Viewed apart from this context, his performance looks like that of many top 5 picks in recent years.
Derrick Rose has certainly exceeded even the lofty expectations set for him, actually garnering some legitimate long-shot All Star talk and early whispers of Hall of Fame potential. Given his play, O.J. Mayo is probably not too far behind in the race to greatness. Timberwolves fans would be in a fury over the lost opportunity for Mayo if Kevin Love had not already developed into one of the top rebounders per minute in the NBA, and a capable scorer as well. Further, Brook Lopez looks like the rarest of breeds in the NBA, a big man who is a physical handful with a diverse skill set. Lopez, picked at #10, is the kind of player who would have gone in the top 3-4 in many previous drafts. Finally, the trio of rookie guards Russell Westbrook, Eric Gordon, and D.J. Augustin give three struggling franchises reason for optimism.
Advantage: Clear win for 2008.
Picks 11-20: In both 2007 and 2008 there is (as expected) a precipitous drop in production from the first ten picks to the next ten (Table 2), and the two classes are quite similar in this strata. At the midpoint of last year, the biggest surprise of the 2007 class was Sean Williams, considered one of the riskiest picks of the draft due to his off-court problems. However, he turned out to be fairly productive as a shot blocker and rebounder. Unfortunately, his star has faded substantially this year.
Table 2: Picks 11-20 in 2007 and 2008 All Star Break Totals
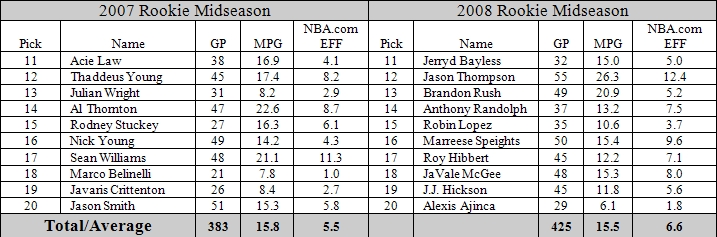
This season, Jason Thompson is the big man making some noise. Thompson, along with sophomore Spencer Hawes, is giving the Kings fans some solace, as the organization seems primarily focused on moving salaries off their ledger. Beyond Thompson, there are a few guys who have played decent minutes and shown well, such as the big man triumvirate of the 16th through 18th picks: Marreese Speights, Roy Hibbert, and JaVale McGee. Finally, if Jerryd Bayless were not in the logjam of young talent that is the Portland Trailblazers, we suspect he would likely be producing much better numbers.
Advantage: Slight edge to 2008.
Picks 21-30: In both 2007 and 2008, three players from the bottom third of the first round had not played a game by the All Star break. In 2007 all three were non-matriculating international players (Rudy Fernandez, Tiago Splitter, and Petteri Koponen), while this year only one of the three is international (Serge Ibaka), whereas the final two picks in the round (D.J. White and J.R. Giddens) simply have yet to see playing time in the NBA, in White's case due to injury.
Table 3: Picks 21-30 in 2007 and 2008 All Star Break Totals
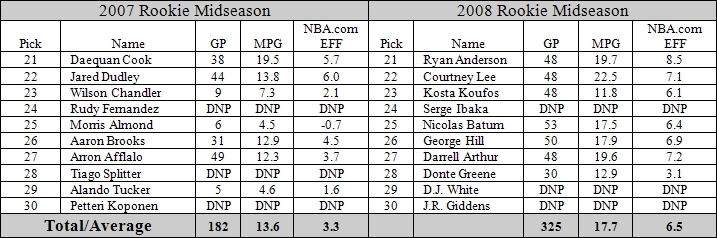
While neither draft produced a breakout star in the bottom of the first round, the seven 2008 draftees have played nearly twice as many games and contributed double the production of the 2007 group. Six of the seven active 2008 rookies have played in the vast majority of their teams' games this year, while that was true for only 3 players last year. Five 2008 draftees are averaging more than 15 minutes per game, whereas only Daequan Cook passed that bar last season. Late first round picks have the challenge of breaking into the lineups of some of the better teams in the NBA, but Courtney Lee, Kosta Koufos, Nicolas Batum, and George Hill have all contributed to teams that are likely playoff bound this season.
Advantage: Strong win for 2008.
Second Round: In both 2007 and 2008, 15 of the 30 second rounders had played in at least one NBA game by the All Star break. The degree of impact (for second round picks, games and minutes played is probably the better metric as production is scant), although not substantial in either year, slightly favors the class of 2008. Two players from the class of 2008 have seen action in at least 35 games by the All Star break, averaging 10 minutes or more of playing time: Mario Chalmers (31.5 mpg), and Luc Richard Mbah a Moute (25.3 mpg). Chalmers, in particular, is a standout: a second round pick who comes in and immediately starts on a playoff-bound team. Mbah a Moute's minutes and production have leveled off a bit after a very fast start in the opening month of the season, but he remains a strong rotation player for the Bucks. A number of other second rounders are making notable contributions to their teams as well: DeAndre Jordan (34 games, 13.8 mpg), Kyle Weaver (29 games, 17.9 mpg), Sean Singletary (37 games, 8.2 mpg), and Goran Dragic (28 games, 12.8 mpg) are all second rounders to watch.
In 2007, only one player, Glen Big Baby Davis (13.2 mpg) of the Boston Celtics, played in as many as 35 games averaging 10 mpg. Aaron Gray (35 games, 9.7 mpg) and Dominic McGuire (41 games, 8.0 mpg) were the only other second rounders to even approach those marks last year. No second rounder in 2007 approximates the impact Chalmers has had, and that alone probably wins the day.
Advantage: Mario leads 2008 to another victory.
Game, set, match: a clean sweep for the draft class of 2008.
Historical Comparison of Draft Classes
In order to compare the current class to the prior 28 drafts, we used the Adjusted Efficiency Score* that we created in 2007 for this purpose. The Adjusted Efficiency Score estimates the total seasonal production for each entire draft class while factoring in seasonal pace differences. For a complete discussion of this metric see our article on the 2006 Draft class.
The draft year Adjusted Efficiencies below (Figure 1) factor in the percentage of draftees active in a given year (thus years with fewer drafted players who play in the NBA will tend to have lower scores), the number of games played by those draftees in each season (thus a player who had 1 very good game will have a lower score than a player who had 50 average games), and production.
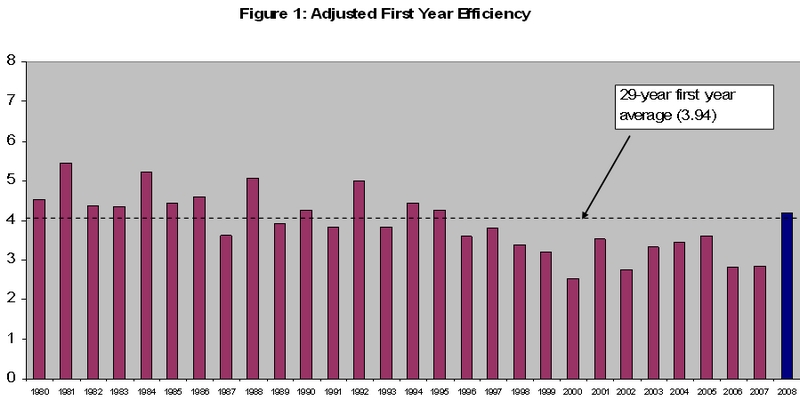
When observed in this manner, the draft class of 2008 is the best-performing rookie class in over a decade. At this point in the season (with teams having played an average of 54 games), the current class has the best Adjusted Efficiency Score of any class in recent history. This class harkens back to the drafts of the 1980s, when rookies (many more of whom attended most or all of their four collegiate seasons than is common now) tended to have a much bigger impact on their teams. The 2008 draft class is outperforming two of those 1980 classes and is only slightly behind five others. In the 1990s only three draft classes outperformed 2008, the last of which being the aforementioned class of 1995.
When placed in the context of the current time, the production of the 2008 class becomes all the more outstanding. To control for historical trends, we compared each draft with the average production of all of the other drafts in that decade (e.g. take 1984's production and divide it by the mean of the other 9 drafts in the 1980s). Viewed in this way, the draft class of 2008's production is 34% higher than the average of the other eight drafts of this decade (Figure 2).
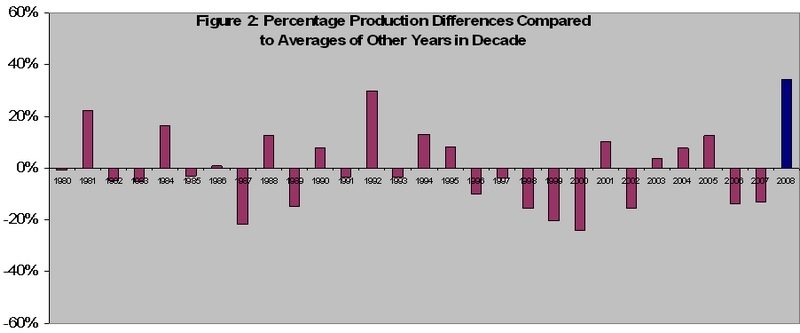
The only other draft since 1980 that has come close to such decade-adjusted relative production is 1992 (the year a certain large center from LSU entered the NBA), which produced 30% more than the other nine drafts of the 90s. After that there is a sharp drop to the highest producing class of the last 3 decades, 1981 (that great class gave us Isiah Thomas, Mark Aguirre, Buck Williams, Tom Chambers, Rolando Blackman, and Larry Nance). Impressive as it was, 1981 only had 22% higher production than the average of the other nine 1980s drafts.
Note that production is typically fairly stable from the All Star break down the stretch: rookie classes typically finish out the year with ratings very similar to those seen in February. Thus, it is a safe bet that we are currently watching the best rookie class to come along in over 15 years. And, placed in the context of how they have outperformed recent classes, perhaps the most startling performance of any rookie class in the past three decades.
Cause for Celebration?
As we have discussed in previous articles, the correlation between first and second year production and later performance, for both individuals and entire draft classes, is weak. Thus the long-range prospects of the 2008 draft class are far from determined. However, there are few things as exciting as the tease of great potential, and the number of rookies this season showing the kind of success that breeds anticipation has been a long time coming. For years, expectations have far outweighed the reality of rookie year performance.
The 2008 draft class has stimulated anew the fantasies of immediate and potent performance, perhaps to the anguish of future draft classes who will be reminded of the first year achievements of Rose, Mayo, Westbrook, Love, Lopez, Chalmers and others. Just when fans were ready to embrace the mantra You can't expect major contributions for a couple years, the class of 2008 turned up the heat. For now, we should all enjoy this rookie class. While it is hopefully a sign of things to come, it could very well be a decade or more before we see another class like it.
*Adjusted Efficiency = [((Pts + Reb + Asts + Stl + Blk) - ((fga - fgm) + (fta - ftm) + turnover))*(92.4/lgpace)]/#draftslots/#games.
Lgpace = Average pace of the NBA for each year as reported by basketball-reference.com
#draftslots = number of first and second round draftees in a given draft year
#games = number of possible games in a year (82 for all years except the strike year of 1998-99)
Note: Data for this article was compiled from NBA.com, Basketball-Reference.com, NBADraft.net, DatabaseBasketball(2.0), and TheDraftReview.com. The authors would like to thank all those involved with developing and maintaining those resources and making them available for public use.


Comments