


Statistical analysis is making headway in player evaluations of many NBA front offices. Teams like the Dallas Mavericks, Cleveland Cavaliers, and Boston Celtics engage specialists to crunch numbers for them. Portland's rising franchise has worked with stat guru & MIT blackjack star Jeff Ma in reconstructing their roster.
This year, DraftExpress yet again provides an in depth draft preview written by Erich Doerr and based on David Berris Win Score metric.
An early version of this article can be found here and the 2008 prospect list here.
Methodology
Wins Produced and Win Scores
Since Bill James broke baseball down into numbers, similar statistical analysis has taken place for each major sport. One reoccurring result is that scoring margin represents a stronger predictor of future performance over alternative metrics, including winning percentage. Scoring margin, the difference between points scored and points allowed, can be broken down to individuals and transformed into statistics like Win Shares and Wins Produced.
In the Wages of Wins, David Berri, Martin Schmidt, and Stacey Brook use econometric analysis to generate an approximation for individual player contributions towards Wins Produced, and call the results Win Scores. Their analysis lays out a simple formula for player evaluation that can be applied to any common basketball box score.
While their analysis was based on the National Basketball Association, the same metric can be applied to players in other leagues, including the NCAA, which is the NBAs largest feeder league.
With the NCAA season over, Win Scores has been calculated for all the 2008 NBA draft prospects and an assessment can be made on draft worthiness. As a basis for evaluation, DraftExpresss mock draft will be used to represent the industry consensus on prospect values. From this basis, we will use Win Scores to identify over and undervalued players in the drafts lottery and furthermore name a handful of valuable prospects likely to be available late in the draft. Using draft picks successfully is a hallmark of legendary general managers and franchise dynasties, not to mention the millions of dollars at stake in todays game.
Historical Results
Last year, I posted a similar draft preview. Before looking at 2008, let's recap and learn from last year's predictions. In reviewing 2007's assessments, I will consider my projection, the draft slot of the player selected and their '07/'08 NBA Win Score, grading in a binary pass/fail basis.
Win Scores highlighted favorites focused on players not likely to be taken in the first round. The three players identified were Nick Fazekas, Stephane Lasme, and Rashad Jones-Jennings. Fazekas and Lasme were chosen with the 34th and 46th picks respectively while Jones-Jennings went undrafted.
On the other hand, Win Scores seemed rather confident in expecting subpar play from highly touted lottery picks Corey Brewer, Spencer Hawes, and Acie Law. The following table shows each NCAA to NBA prediction along with a grade.
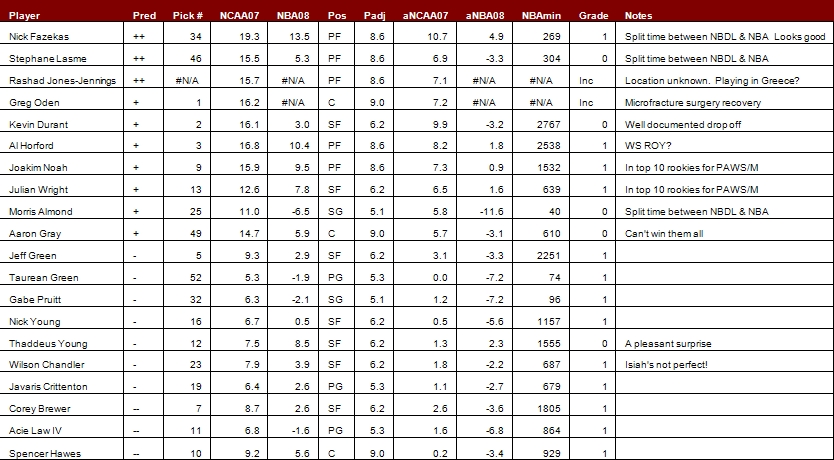
Predictions were not provided for all players, as the data was neither favorable enough nor pessimistic enough given a player's projected draft slot. Where predictions were made, Win Scores shot around 70% on NCAA players, remarkably better than most, if not all, GMs draft histories.
On the international side, results apparently weren't as successful. After a heavy dose of assumptions on unavailable statistics, Yi Jianlian, Rudy Fernandez and Jonas Maciulis seemed good enough to endorse while Tiago Splitter warranted pessimism. Yi was the only one to be signed and play NBA minutes, though his results were a disappointing -2.7 PAWS/40. For the time being, judgment will have to be reserved on the other three.
How can these results be improved? First, a dose of humility may help in international player assessment. It appears league strength makes international league comparisons difficult for the time being. Second, we'll be paying much more attention to strength of schedule and collegiate pace in projecting prospects, given positive data and reader feedback.
Comparative Adjustments
Strength of Schedule
Wins Produced and Win Scores were developed based on NBA statistics. In the NBA, talent is relatively evenly dispersed when compared against lesser leagues. While the NBAs talent is spread among 30 clubs, the NCAA has 341 division I-A teams, running the gamut from talent-laden National Champion Kansas to the 0-29 New Jersey Institute of Technology.
A player's success depends not only on his prowess, but also on what his opponent allows them to do. With this in mind, last year we compared a given player's WS marks while playing against tournament-qualifying teams next to their marks against all other opponents. Most players posted significantly better marks against non tourney teams.
This year, we will rely on a similar measure. Specifically, Ken Pomeroy's team ratings will define the 100 best teams, which will serve as the basis for strength of schedule analysis.
By using Ken Pomeroy's team ratings over the NCAA tournament field, we are able to exclude poor quality tournament teams such as Coppin State (ranked 310th out of 341 teams by Pomeroy's stats). Using 100 teams as a common basis also allows for larger sample sizes while at the same time maintaining a respectable level of quality competition.
In the 2008 prospect list, these statistics are notated as KP100 for PAWS/40 against top 100 teams. PAWS/40 stands for Position Adjusted Win Score per 40 minutes. (Note: The DraftExpress database reports WS/40. To adjust this number for a position, subtract 9 for C, 8.6 for PF, 6.16 for SF, 5.12 for SG, and 5.28 for PG.)
Pace Adjustment
Given a variety of offensive and defensive schemes, a box score metric like Win Scores is susceptible to the number of possessions in a game. Certain coaches slow the game down by applying conservative defensive principles and clock-eating offenses while others prefer aggressive defenses and high tempo offenses. Given these disparities, a pace factor can be calculated by assessing the average number of team possessions in game. The pace factor can then be applied to Win Scores to find a tempo-neutral value.
For an example, the below table compares two players from a fast paced team (North Carolina) against two similar players from slower paced teams (Georgetown and Washington State). After adjustments, these players grades come out much closer than originally calculated.
Pace adjustments for all players are included in the complete 2008 prospect list.
Assessing The Projected First Rounders
A collection of comments on the drafts very best.
Michael Beasley: 10.9 PAWS/40
Before the 2007 draft, many statistical analysts, including Jeff Ma, David Berri, and John Hollinger, noted the greatness of Kevin Durants only college season. In many respects, Beasley meets or beats several of Durants marks.
Though Durant has not yet lived up to expectations, Beasleys Win Score marks are off the charts and will certainly be the consensus statistical top prospect.
Compounding the case for Beasley are the scouts. Doug Thonus of DraftExpress offers a pair of Bullsbeat podcasts reviewing every NCAA possession of Michael_Beasley and Derrick_Rose, concluding Beasleys game is offensively prolific and NBA ready.
On the court, the only significant questions include his defense and adjusting as a team player, however, these seem to be small grapes compared to his monstrous statistical projection. According to (some of) the scouts and the stats, Beasley tops the draft board.
Derrick Rose: 3.2 PAWS/40
Roses statistics were underwhelming for a purported top two talent, though some interesting splits occur when analyzing his game logs.
First off, a curious split occurs in his rebounding. Against top 100 teams, Rose posted 7.5 boards a game, compared to 4 rebounds a game against the rest. Does this signify a lack of effort or statistical anomaly? Better rebounding numbers strongly indicate potential NBA success.
Second, up until February, Roses numbers were a purely mediocre 1.2 PAWS/40, though from February 20th on, Rose turned up his play and notched a 6.2 PAWS/40 for the last 15 games. A 6.2 PAWS/40 favorably compares to Chris Pauls collegiate full season PAWS/40 marks of 4.7 and 5.0. Given Rose can sustain such play over a full season, Rose will become the star many expect him to be.
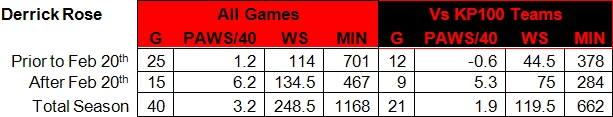
Even if the splits above come out in Roses favor, Michael Beasleys 10.9 PAWS/40 definitively stands above any projection of Derrick Rose. Draft history is also in Beasleys favor, as the last two players under 66 drafted first overall include only Allen Iverson (1996) and John Lucas (1976).
Kevin Love: 10.1 PAWS/40
Purely on the numbers, Love makes a solid case as the top 2008 draft prospect. While Beasley sports a higher 10.9 PAWS/40, Love bests him when either adjusting for pace or competition.
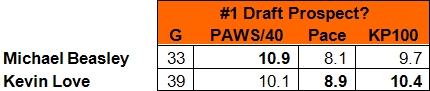
Also, as described in the Wages of Wins, there are diminishing returns in basketball. In other words, having many good players on a team can understate the statistical quality of an individual player. This means that if Michael Beasley went to Kansas rather than Kansas State, his PAWS/40 would likely not have been as high.
Given this information, Kevin Love looks even better in comparison, as UCLA is loaded with projected NBA talent, and Kansas State is devoid of it.
Will Kevin Love become a better player than Derrick Rose and Michael Beasley? The question is certainly intriguing, but given these players projected draft value, Kevin Love seems to be quite underrated and certainly a draft value whenever he comes off the board.
O.J. Mayo: 0.7 PAWS/40
In a May 24th interview with Jonathan Givorny, O.J. Mayo compares himself to Deron Williams, though the stats dont support the comparison. Throughout Williams collegiate career, he posted about 16 points-per-40 and assist-to-turnover ratios well above 2. Comparatively, Mayo scored 22 points-per-40 and his A/TO did not break 1. A more appropriate comparison would be Gilbert Arenas, given his collegiate 21 points-per-40 and .8 A/TO rates.
While Gilbert Arenas is a highly popular player, Win Score analysis suggests his value is higher with fantasy players than Wizards fans, and similarly predicts Mayo to be an overrated basketball asset. Specifically, Mayos poor A/TO ratio and his .7 PAWS/40 mark do not impress, and suggest Mayo, like Arenas, will be more productive for fantasy teams than actual ones.
Luckily, there is a bright side. Mayos last month of games showed a lot of promise, as he posted a 4.5 PAWS/40 and a A/TO ratio approaching 2 to 1. If Mayos last 9 collegiate games are more predictive than his previous 24, Mayo may live up to his high pre-draft expectations.
Jerryd Bayless: 0.6 PAWS/40
Up front, some analysts will dispute Win Scores point guard ratings. Compared with other metrics, such as PER, there are distinct discrepancies in PG ratings. When looking at Win Scores ratings of PG prospects, similar disagreements appear against many prospect ranking lists. Current mock drafts have Jerryd Bayless as a consensus top 6 pick, while his collegiate .6 PAWS/40 does not stand out.
While Bayless is young and may improve, his turnover rates and weak rebounding suggest that hell likely not pan out to the all star guard many predict.
D.J. Augustin: 0.4 PAWS/40
Kevin Durant was a historically great college basketball player, despite his loss, the Longhorns had a strong season and pulled down a #2 seed in the tournament rather than the #4 seed achieved with Durant.
Many observers attribute this accomplishment to D.J. Augustin, given a 5 point increase in PPG and widespread acceptance of Augustin as their best remaining pro prospect. Win Scores analysis disagrees, and attributes Texas success to improvements by Damion James and Conner Atchley.
Despite the shift in Augustin's stats with and without Durant, his PAWS/40 went relatively unchanged. Augustin still rates as an average point guard with a .4 PAWS/40 and not as the superstar prospect so many expect. Given this information, Win Scores is highly pessimistic of Augustins pro potential.
Anthony Randolph: 0.2 PAWS/40
Yet another of the one-and-done players, Anthony Randolph has his sights set high. In an interview with Joey Whelan, Randolph mentions his expectations to be drafted between the fourth and tenth pick. Statistically, Randolph clearly doesnt warrant a lottery pick, and may not even be worth a guaranteed contract.
While Randolphs shot blocking is promising, other indicators bode poorly, such as his high turnover rate. Additionally, Randolphs performances were significantly worse when playing top competition. Against Ken Pomeroy top 100 teams, Randolph posted a -1.7 PAWS/40.
Overall, the statistics paint a bleak picture for Anthony Randolph and the team that drafts him. His best hope is plenty of growth from his age-18 season and a possible position switch to small forward.
Russell Westbrook: 0.7 PAWS/40
As his pre-draft stock rises, Russell Westbrooks collegiate statistics are set in stone, and markedly average. To this stat-head, Westbrook appears to be one of this years workout wonders, relying on freakish physical attributes rather than on the court performance.
While UCLA was good, a Win Scores analysis attributes most of that success to phenom Kevin Love, as noted above.
To become a valuable NBA player, Westbrook will have to learn to channel his athleticism into basketball productivity. In his favor, hes got youth and remarkable improvement from his prior season, but Win Scores remains skeptical.
DeAndre Jordan: 1.9 PAWS/40
Jordan may be tall and athletic, but that hasnt translated into productivity. His limited collegiate minutes suggest he is purely a project, and Win Scores agrees. While on the court, Jordan was somewhat productive, but that productivity reversed when playing top 100 teams, as he posted a -1.7 PAWS/40. This large swing in productivity suggests his stats were generated by abusing the short and under talented, none of which is to be found in the NBA.
Eric Gordon: 0.3 PAWS/40
While Gordon is young and can cite a coaching distraction, his statistics clearly indicate an overrated prospect. Among basketball fans, there seems to be a consensus that Gordon is likely top 7 prospect and certainly lottery worthy. Statistically, there are several worrying signs, including a high volume of turnovers and a low assist-to-turnover ratio. Furthermore, there are signs Gordon feasted on the weak, as he put up a -2.9 PAWS/40 against Ken Pomeroys top 100 teams.
By the numbers, teams should steer away from selecting Eric Gordon and save themselves millions of dollars and handfuls of losses.
Joe Alexander: 2.0 PAWS/40
The reports on Alexander come back raving on his relentless work ethic, and this desire to improve also translates in his stats.
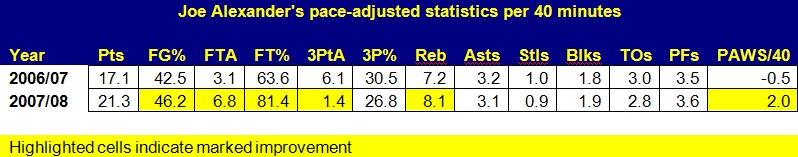
Alexander has used his work ethic to improve, and the sky may be the limit if his habits are maintained. That being said, on a straight statistical basis, his 2007-2008 season doesnt excite. Alexanders PAWS/40 drops to 0.1 against top 100 competition and he may have spent all his upside with his junior year accomplishments. Following Joe Alexanders NBA career should provide an excellent example of how far work ethic can take you in the world of basketball.
Brook Lopez: 1.8 PAWS/40
When comparing advanced statistics like PER & Win Scores, differences arise. Between these two metrics, PER favors players that create a lot of shots while Win Scores focuses on efficiency. Brook Lopez exemplifies a prospect where these differences come into play. Lopez puts up a lot of offense, but uses a ton of possessions in doing so. Several people have pointed out Lopezs 46% FG despite his great size for the NCAA. What does this say about his future prospects?
Both measures see some promise in Lopez and grade him above most of the other projected lottery picks. The positives include size, youth, and improvement over last year, though when compared to PER, Win Scores remains relatively unenthusiastic about Lopez dominating the NBA.
Danilo Gallinari: 4.2 PAWS/40 Italian league, 0.5 PAWS/40 in Euroleague
19 year old Gallinari is no Rudy Fernandez, though he has youth on his side. Gallinaris 4.2 PAWS/40 compares directly with another recent Italian import, Andrea Bargnani. Bargnani put up a 4.5 PAWS/40 in the Italian league in his age 20 season, and a Win Scores analysis is harsh on Bargnanis development. The Euroleague provides a much better level of competition, and so far Gallinari has not stood out. His development may be helped by a few seasons overseas, and given that cost, should not be selected in the top half of the first round.
Donte Greene: -0.6 PAWS/40
While Greene had an excellent start last season, he actually hurt his team overall with a sour second half, winding up with a negative PAWS/40. Considering Syracuses fast paced play, this assessment may even understate the damage.
If Greene returns to his early form, posting a 5.1 PAWS/40, hes well worth a lottery pick. If his second half is more indicative of his skill, then picking Greene is a guaranteed losing proposition. The determining factor will likely be Greenes FG%, as he shot 42% at Syracuse.
Marreese Speights: 7.2 PAWS/40
Coming out of the shadows of Al Horford, David Lee, and Joakim Noah is yet another excellent Florida PF prospect. Speights offers a strong set of big man skills and delivered an astounding 12.4 PAWS/40 during 2006-2007, though under limited minutes. Even after the departure of Noah and Horford, Speights posted a 7.2 PAWS/40, but played a mere 24 minutes per game, mostly due to poor conditioning. Now entering the draft process, Speights has made great strides in conditioning, though questions on work ethic remain.
Given his stellar production, Speights is a deserved lottery pick and even makes a solid statistical argument for a top 5 selection.
Roy Hibbert: 3.9 PAWS/40
Hibbert posted great numbers his last three years despite the cement-slow Georgetown tempo. Unlike DeAndre Jordan, Kosta Koufos, and Javale McGee, Hibberts success also comes against good competition and players his size, such as Connecticuts Hasheem Thabeet.
Statistically, Hibbert had a better year in 2006/7, which John Hollinger cites as a promising indicator. Last year, Hibbert would have graded out as a lottery pick, and if hes taken in the late first round as several mock drafts predict, his new owners may feel like lottery winners.
Quick Hits: (PAWS/40)
As mentioned above, Javale McGee (2.0) and Kosta Koufos (1.3) had problems against top 100 competition, posting -1.3 and -0.6 PAWS/40 respectively.
Small school guard Courtney Lee posted a fantastic 6.4 PAWS/40, but fed on a weak schedule, and only put up a -0.7 PAWS/40 in his 8 games against top 100 competition.
NCAA Championship game guards Mario Chalmers (5.1), Brandon Rush (2.2), and Chris Douglas-Roberts (4.4) all show promise.
Big school big men Darrell Arthur (1.0) and Robin Lopez (0.2) do not project well.
No Guarantees: Beyond the Projected First Round
Past the projected top 30, there are a handful of Win Score favorites highly likely to pleasantly surprise their new organizations. Richard Hendrix, Chris Lofton, and Joey Dorsey all appear to be excellent NBA prospects per Win Score. These gentlemen are coming out of strong programs, yet seem underappreciated by the scouting majority.
While DraftExpresss scouting report on Richard Hendrix is positive, his mock draft spot winds up south of the first round. Hendrixs body of work is solid, posting consistently high PAWS/40 regardless of competition (marks of 5.7 vs top 25 and 6.5 vs top 100). To lock this guy up for 4 years would be a solid investment for any NBA team.
This year, Tennessee guard Chris Lofton posted an initially unimpressive 2.1 PAWS/40, though that comes with an asterisk. Lofton's biggest opponent this year was not on the Volunteer's schedule, it was cancer. Lofton's story was kept quiet until recently, and all signs point to a full recovery.
Prior to this season, Lofton has consistently put up high marks, posting PAWS/40s of 5.4, 5.0, and 5.8, which put him in similar territory to Brandon Roys 2006 6.6, Rodney Stuckeys 2007 4.9, and Rajon Rondos 2006 4.9. While Loftons measurables may come up short against the other three, he certainly seems to be undervalued by mock drafts, as some even have him going undrafted. Despite his shortcomings, Lofton clearly should hear his name called on draft day.
Finally, Memphiss Joey Dorsey just plain puts up amazing Win Scores. Looking at his history, you'll understand why I sighed a big breath of relief as Dorsey fouled out of the National Title Game. Dorsey, not Derrick Rose, was the engine that drove the Memphis Tigers through the regular season, and both players stepped up for a fantastic tournament run. Rose may go 30 picks earlier, but Dorsey can well prove to be the better value given the cheap projected price of a 2nd rounder.
Outside the big programs, there are three smaller school guards and two big men that are intriguing, though the case for a full-fledged endorsement is hampered by a small sample size against serious competition.
VMIs Reggie Williams has posted outstanding 10.7 and 11.0 PAWS/40 over the past 2 years while leading the NCAA in scoring. While these appear to be extremely good, there are several caveats, including inflation by VMIs breakneck tempo, the lack of quality competition, and the lack of success (Ken Pomeroy ranked VMI in the mid 200s out of 320+ Division I teams). Keep an eye on the summer leagues to find out if hes a system guy or a hidden gem of a prospect.
New Mexico guard J.R. Giddens destroyed weaker competition in gathering a PAWS/40 of 8.2 in 2007, but had no games against the top 25 and posted a poor 2.3 in PAWS/40 his junior year.
IUPUIs George Hill posted a solid 7.3 PAWS/40 and a 4.3 PAWS/40 in his 5 games against top 100 competition. Furthermore, Hill posted a decent 4.8 PAWS/40 in his freshman year, showing 2007-2008 may not be a fluke.
Nebraska center Aleks Maric came on strong with a 7.7 PAWS/40 in his senior campaign along with two monster games against Kansas State. Though his Win Scores are solid, his age and late bloomer status suggest limited upside.
Riders Jason Thompson was the NCAAs 2nd place finisher in rebounding (after Beasley) and offers an impressive 7.5 PAWS/40 though most of that comes against weak competition. Fellow stat analyst Bradford Doolittle makes a case for optimism.
Quick Hits: (PAWS/40)
Shan Foster (6.2) posted a solid season, though his career history suggests this high score may be based on a lucky FG% season. Pat Calathes (5.2) put up strong marks against strong competition and over the past 2 years. Bill Walkers numbers (1.9, -0.2 vs top 100) suggest hes purely average. D.J. White (6.5), J.J. Hickson (4.6), and Ryan Anderson (5.9) put up similar PAWS/40 that appear superior to most mid-first round big men projections.
International Roundup
Assessing International Players
Attached to the end of the Win Scores 2007 Draft Preview was a short blurb on international prospects. A handful of predictions were made that don't appear to be as accurate as the NCAA assessments. This year, the predictions are looking to improve, given better data and more thoughtful analysis.
In 2007, the data used to assess international players did not include minutes played, personal fouls, nor turnovers. These stats are key to calculating Win Score and, in their absence, assumptions were made to estimate these values. This year, the assumptions are no longer necessary, thanks to the wonderful and ever-expanding DraftExpress player database.
2007's recommendations touted Yi Jianlian, Rudy Fernandez, and Jonas Maciulis, while shorting Tiago Splitter. With DraftExpresss complete data set, the 2007 assumptions disappear and players like Jonas Maciulis and Marco Belinelli become less interesting prospects. Unfortunately, Yis pre-NBA data remains unavailable, so the assumptions must stand. His rookie year disappointed, as he was unable to put up anywhere near the stats compiled in Asia. While Yi may develop into the player projected, he currently seems to have been overdrafted at the 6th best player in 2007 Draft.
On the other side, Rudy Fernandez was selected by Portland in the middle of the first round and stayed overseas last season. By the stats, he played even better in 2007-2008, returning a 8.5 PAWS/40 in the ACB and a 8.2 in the ULEB Cup. With Fernandez coming to the NBA this year and Greg Oden's delayed rookie season, Portland sports 2 top Rookie of the Year candidates even before the 2008 draft takes place.
Overseas Class of 2008
With the expansion of the DraftExpress database, many of the top internationals can be compared statistically, though hurdles do exist. The international leagues offer varying strengths of competition, shorter seasons, and slightly different rules. Even with the database expansion, some leagues are not captured, making Serge Ibaka, Alexis Ajinca, Ante Tomic, and Nathan Jawai unavailable for statistical assessment.
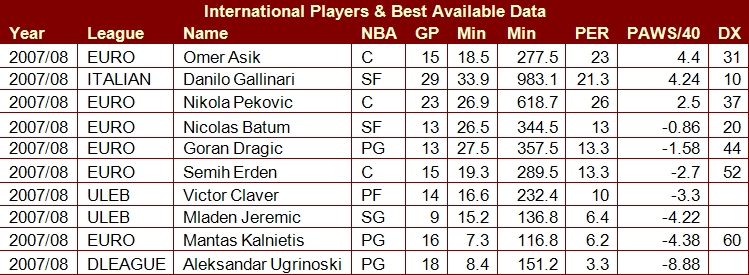
Using the available data and Win Scores analysis, only one player stands out as a predicted bargain. Omer Asiks statistics show solid promise, given a 4.4 PAWS/40 in the Euroleague, albeit in under 300 minutes. Projected lottery pick Gallinari posted a similar 4.2 PAWS/40, though that came against inferior Italian league competition.
The rest of the 2008 international class appears to be unremarkable.
A Perspective on the 2008 Drafts Depth
Win Scores may be optimistic on Beasley and Love, but how do they measure up historically? To answer this, I dug up last years numbers and ran a quick comparison between Win Scores favorite big men, 2007 versus 2008.
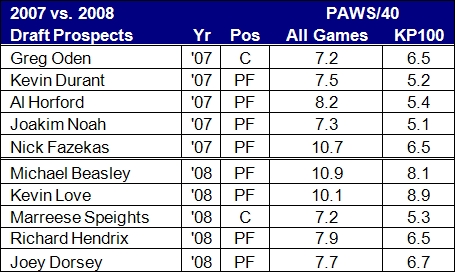
It appears Beasley and Love grade out solidly higher than Oden & Durant. In general, the class of 2008 generally can claim higher Win Scores than the class of 2007.
Thanks for reading, and check back here before the draft for more!
- Erich Doerr .


Comments